
TOCForceMomentCoupleSystem of ForcesStatic EquilibriumStructure AnalysisDistributed ForceFriction Force Draft for Information Only
Content
Internal Forces
in Beams
Internal Forces in BeamsThe shearing forces and bending moments due to concentrated load and distributed load in a statically determinate beam can be determined by the equilibrium equations. Using the standard convention, the distribution of internal forces in a beam can be represented graphically by plotting the values of shear or bending moment against the distance from one end of the beam. Since both shear and bending moment in the beam is created by the applied load, relations among load, shear and bending can be used to develope formulas for calculating load, shear and bending moment in the beam. In general, relations among load, shear and bending moment can therefore be applied to variable distributed loads and distributed moment also. Simply Supported Beam with Variable Distributed Load ExampleFor example, ignoring the horizontal forces, a simply supported beam with variable distributed load in the form of an oblique straight line over the span L of the beam. 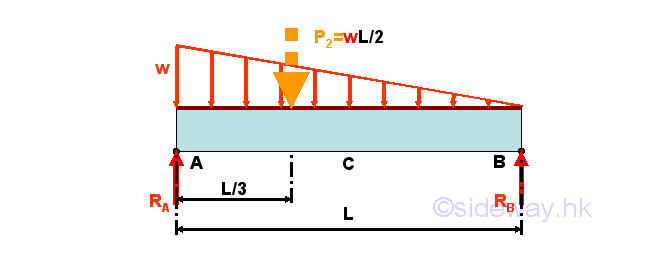
For the variable distributed load over the span L of the beam linearly with maximum w per unit length at point A and zero intensity at point B, the variable distributed load can be represented by an equivalent concentrated force of P2=wL/2 acting at the centroid of the distributed load, i.e. one third of the span measured from point A on the simply supported beam. The reaction forces can also be determined by setting up the equilibrium equations. Imply 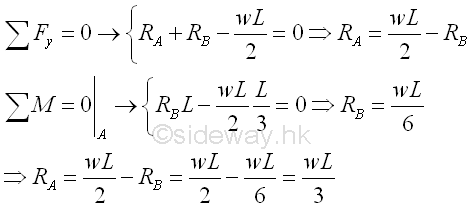
Shear DiagramUsing the concept of the negative signed area, a concentrated load causes a discontinuous jump of shear while a distributed load causes a continuous change of internal force, shear. Start drawing the shear diagram from point A at the left side of the beam at which the beam is in equilibrium and the shear is assumed to be equal to zero. Imply 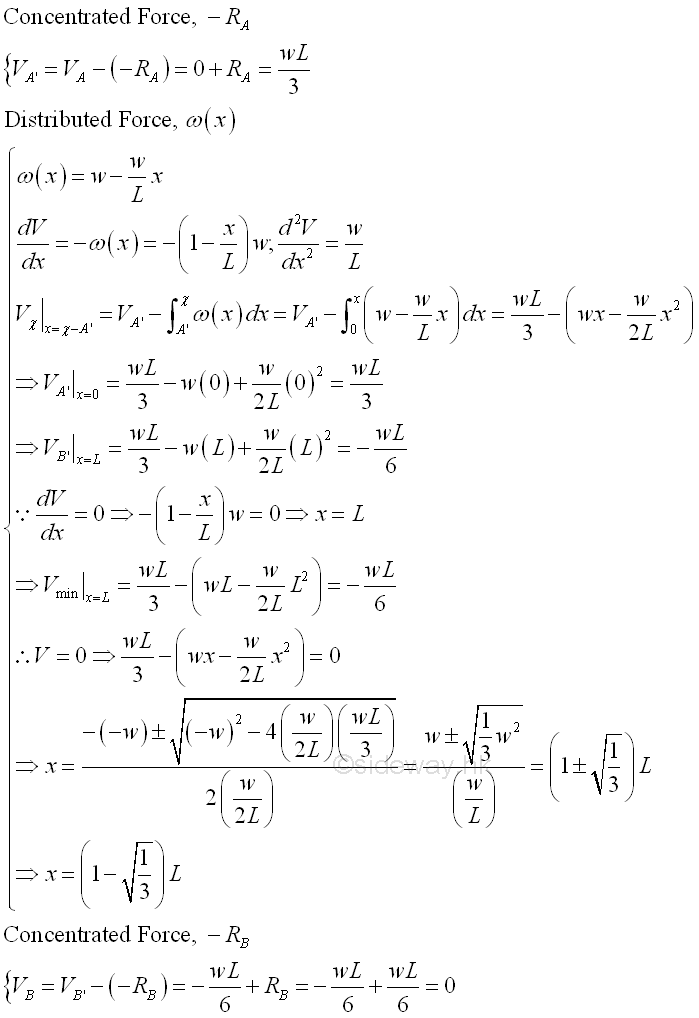
The two concentrated external forces cause two step jumps on the shear diagram. The shear curve of the variable distributed load is a parabolic curve of second degree with slope -(1-x/L)w. The shear curve is a convex upward curve drawn from the shear of last imaginary element with local minimum equal to -wL/6 at x=L. The shear diagram is 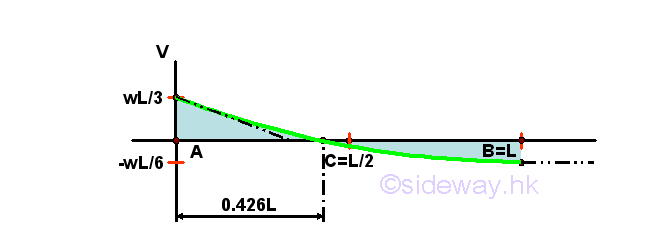
The shear curve becomes a parabolic curve of second degree instead of an oblique straight line when the distributed load is changed from a horizontal straight line of zero degree to an oblique straight line of first degree. Bending Moment DiagramUsing the concept of the signed area, a concentrated load causes a single concentrated moment about the right hand side of a imaginary beam section while a distributed load causes a continuous concentrated moment about the right hand side of a imaginary beam section. Start drawing the bending moment diagram from point A at the left side of the beam at which the beam is in equilibrium and the bending moment is assumed to be equal to zero. Imply 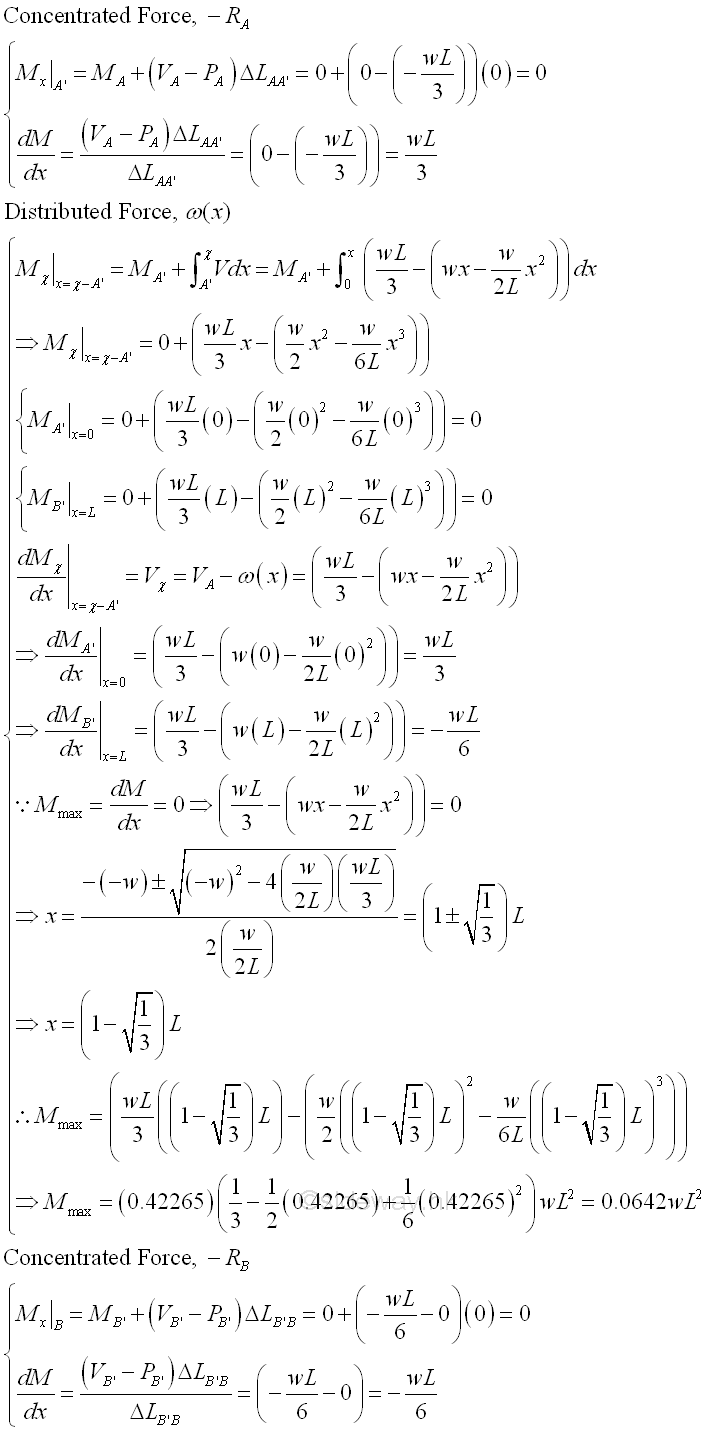
The bending moment curve is a cubic curve of the third degree with maximum bending moment of 0.0642wL^2 at position 0.4227L, i.e. at which shear equal to zero. And both the bending moments at point A and point B are equal to zero. But the slope of bending moment curve at point A' is wL/3 and the slope of the bending moment curve at point B' is -wL/6. The bending moment diagram is 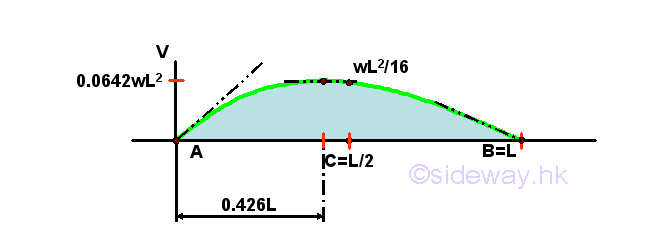
The bending moment curve becomes a cubic curve of third degree instead of an parabolic curve when the shear is changed from an oblique straight line of first degree to a parabolic curve of second degree. Simply Supported Beam with Concentrated Load, Variable Distributed Load and Concentrated Couple ExampleFor example, ignoring the horizontal forces, a simply supported beam with variable distributed load in the form of an oblique straight line over the span L of the beam, a concentrated load and a concentrated couple. 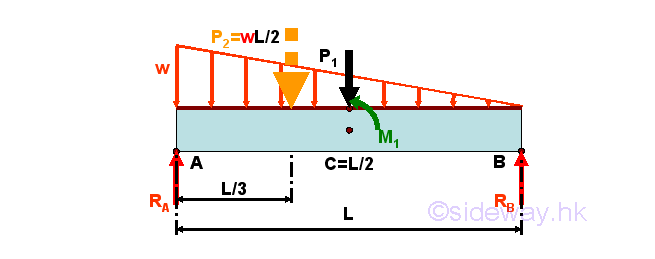
For the variable distributed load over the span L of the beam linearly with maximum w per unit length at point A and zero intensity at point B, the variable distributed load can be represented by an equivalent concentrated force of P2=wL/2 acting at the centroid of the distributed load, i.e. one third of the span measured from point A on the simply supported beam. Together with the concentrated load P1 and the concentrated couple M1, the reaction forces can also be determined by setting up the equilibrium equations. Imply 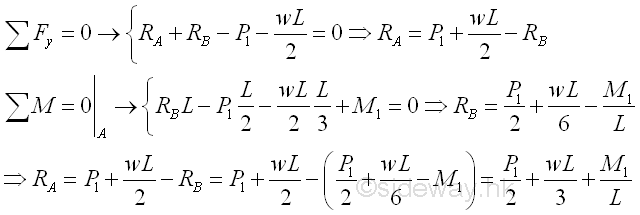
Besides the additional concentrated load, the additional concentrated couple M1 at the middle of the beam will create addional shear and bending moment in the beam. The shear diagram of a positive concentrated couple is 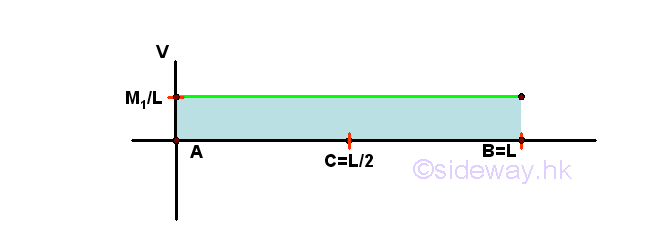
And the bending moment diagram of a positive concentrated couple is 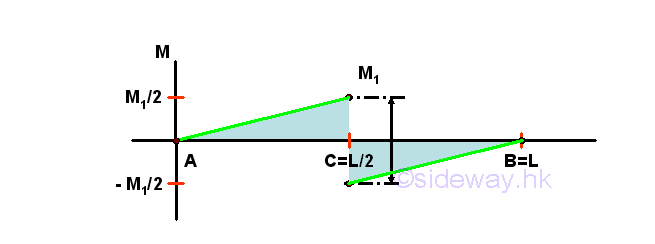
Shear DiagramUsing the concept of the negative signed area, a concentrated load causes a discontinuous jump of shear while a distributed load causes a continuous change of internal force, shear. The shear curve is a piecewise curve of slope -(w-wx/L), a function of x on the beam, throughout with a jump at position C. Unlike the uniformly distributed load, the slope of the shear curve due to the variable distributed load is a function of x, therefore the shear curve is a parabolic curve of second degree, not an oblique straight line, and the signed area under each curve segment should be determined separately. 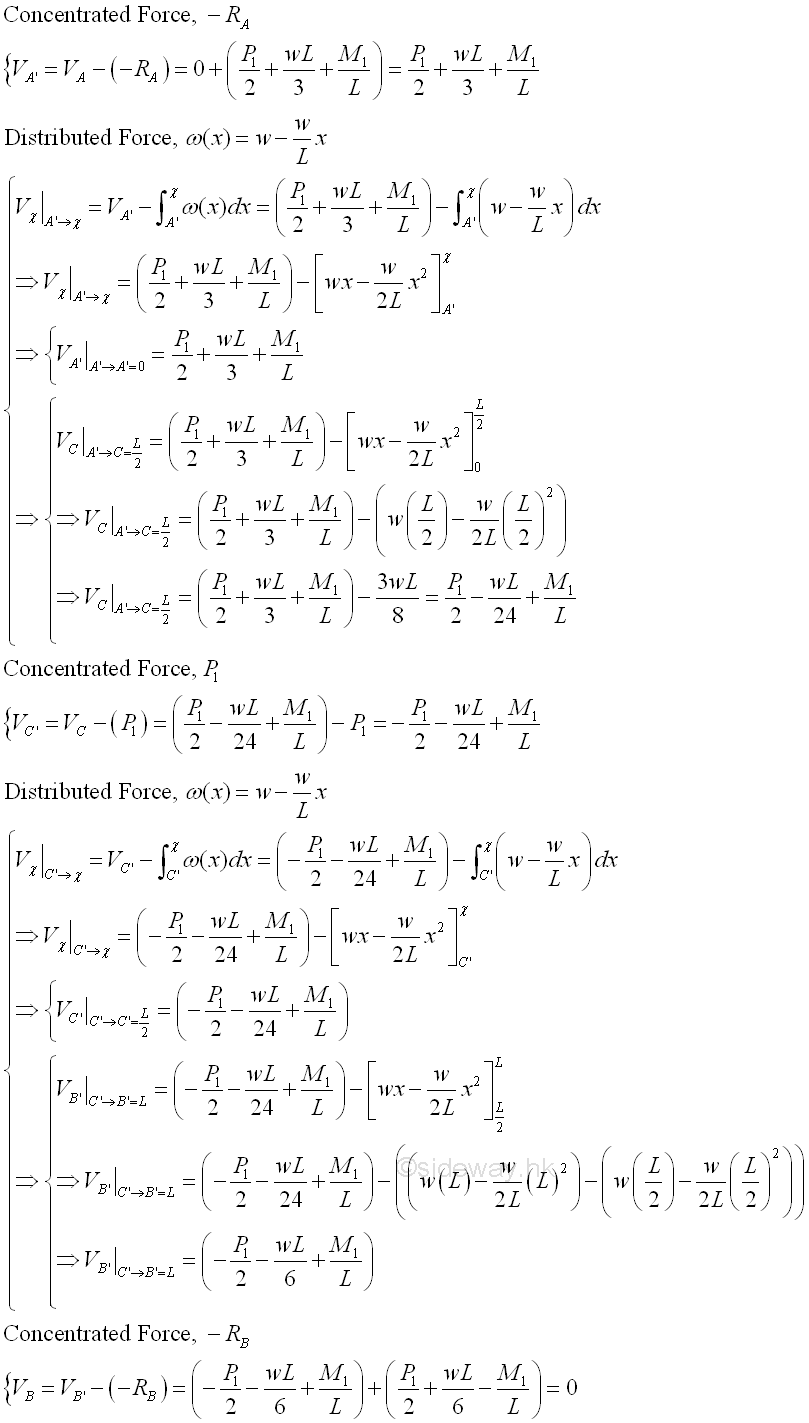
The shear diagram is 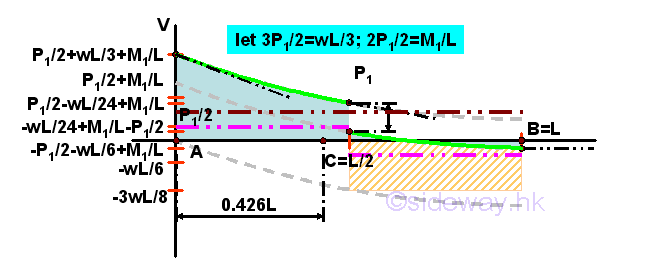
Bending Moment DiagramUsing the concept of the signed area, a concentrated couple causes a discontinuous jump of bending moment while a continuous shear causes a continuous change of internal force, bending moment. The bending moment curve is a piecewise curve of slope V(x), a function of x of degree 2 on the beam, with a jump at position C. Unlike the uniformly distributed load, the slope of the bending moment curve due to the variable distributed load is a function of x of degree 2, therefore the bending moment curve is a cubic curve of third degree, not an parabolic curve and the signed area under each curve segment should be determined separately. Besides, the ratio method used in uniformed distributed load can not directly used in the variable distributed load since the shear curve of a variable distributed load is not a oblique straight line. The signed area under the curve should be adjusted by deducting the accumulated shear before the interested segment because the shear curve is a accumulative curve and the area under the curve is double considered in the shear function of the segment A'C. Imply 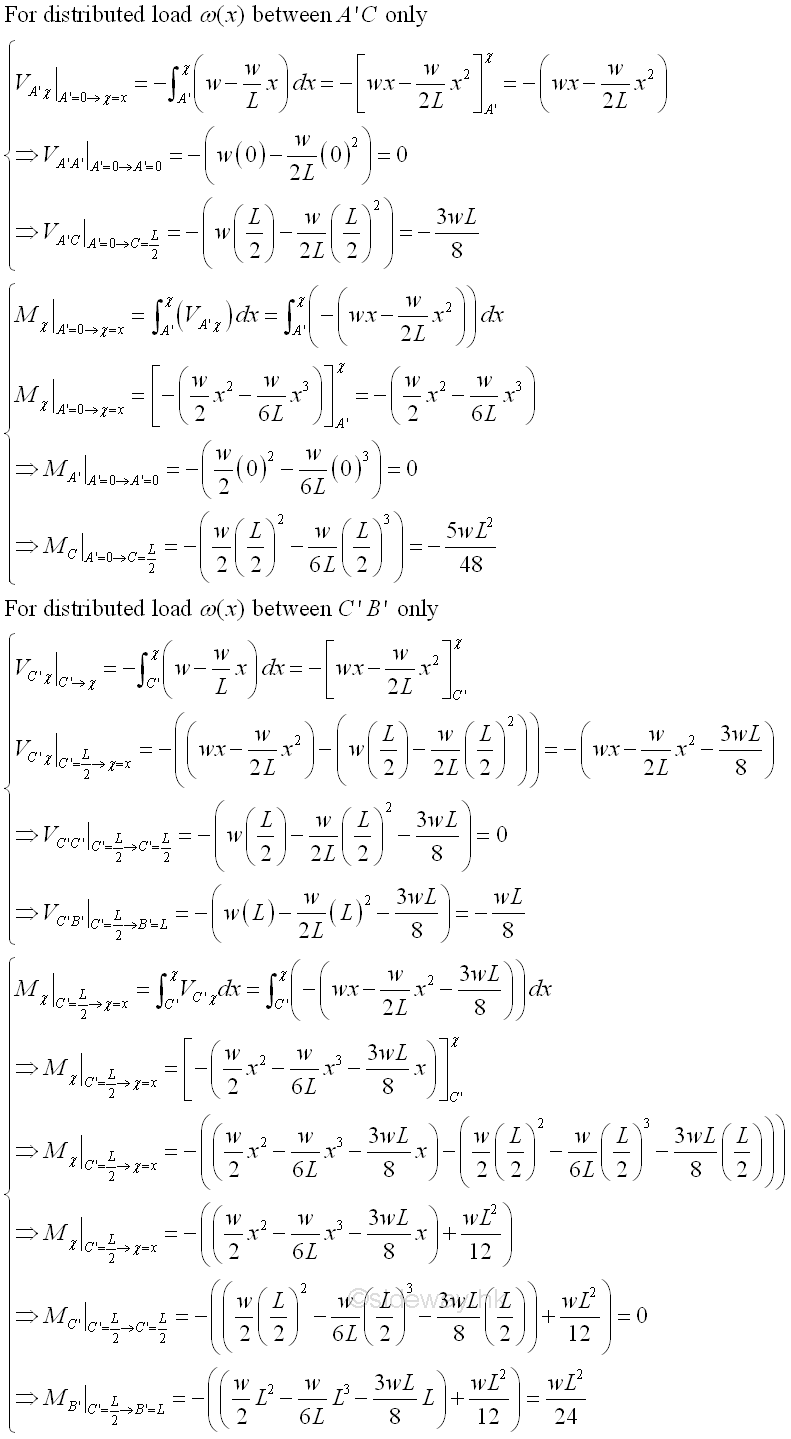
Therefore the bending moment in the beam is 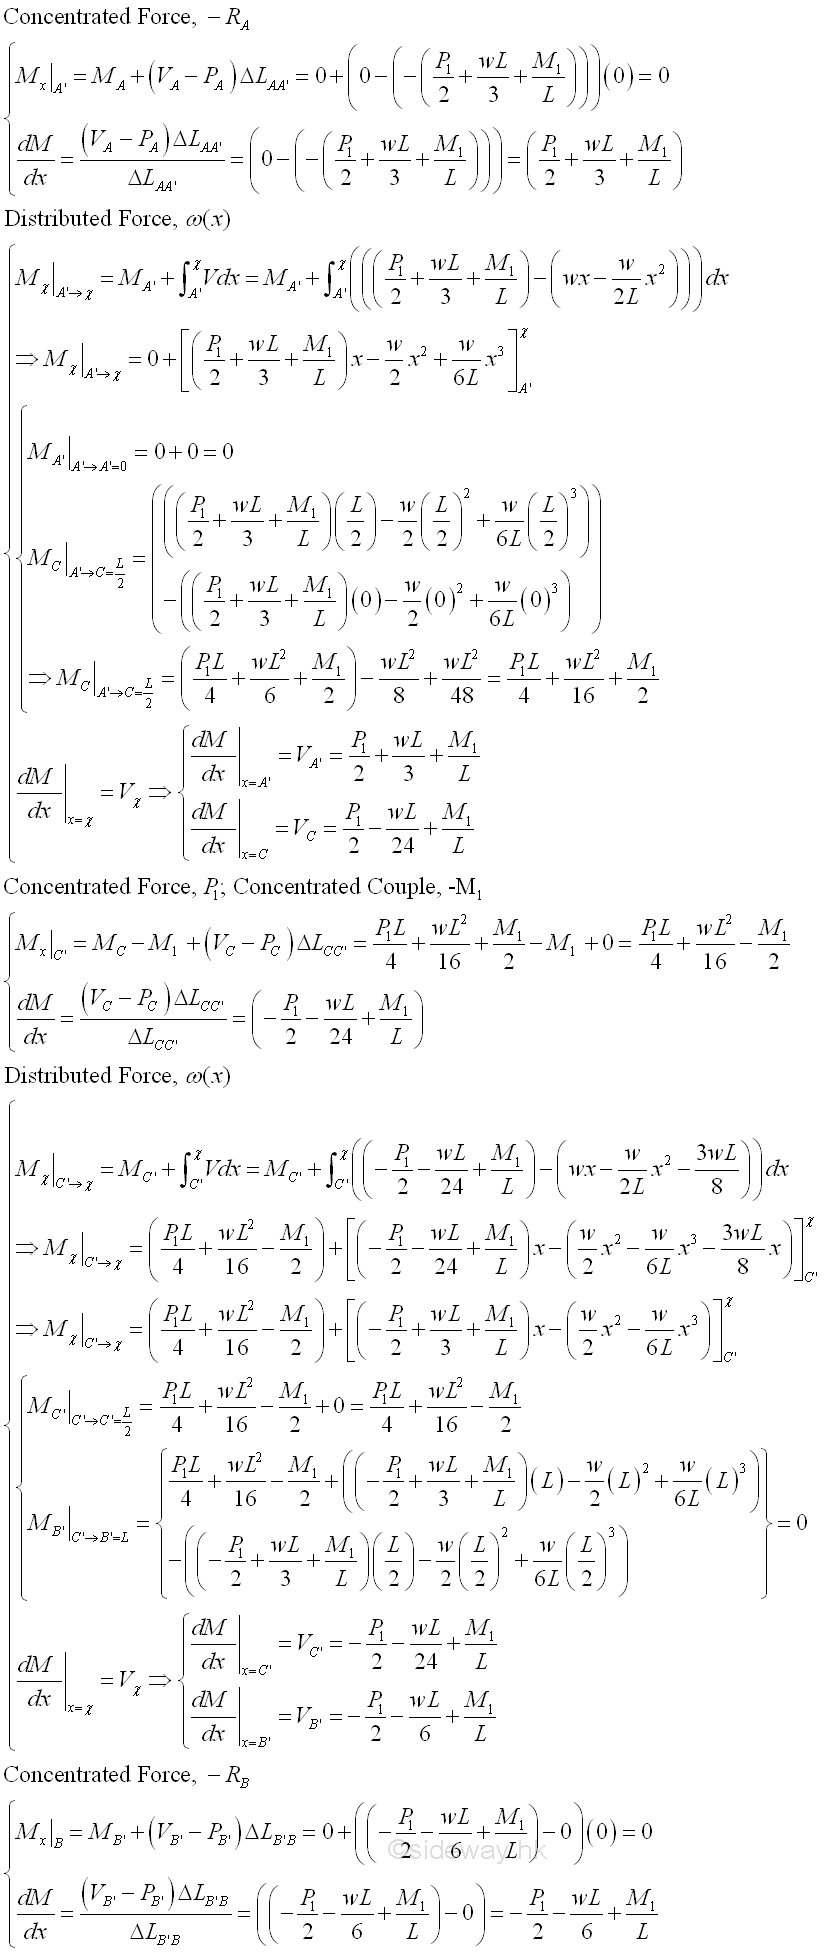
The bending moment diagram is 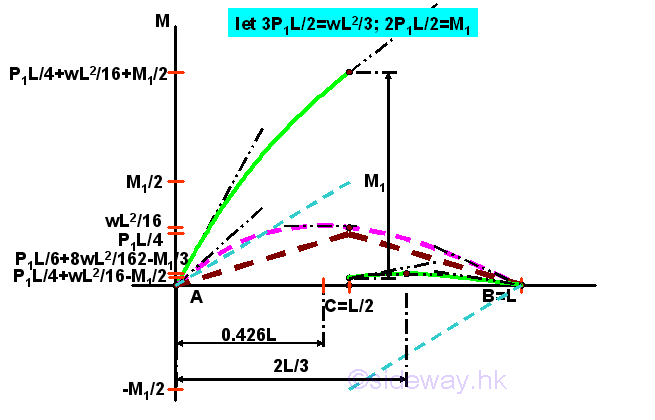
Besides the sudden change in bending moment due to the addition of a concentrated couple on the beam. The additional concentrated couple will also create additional shear in the beam. The additional shear created by the additonal concentrated load and concentrated couple will change the shape of the bending moment curve. The local maximum is not on the first curve segment, but is on the seconde curve segment. The location of the local maximum is on 2L/3 at which the shear is equal to zero. Imply 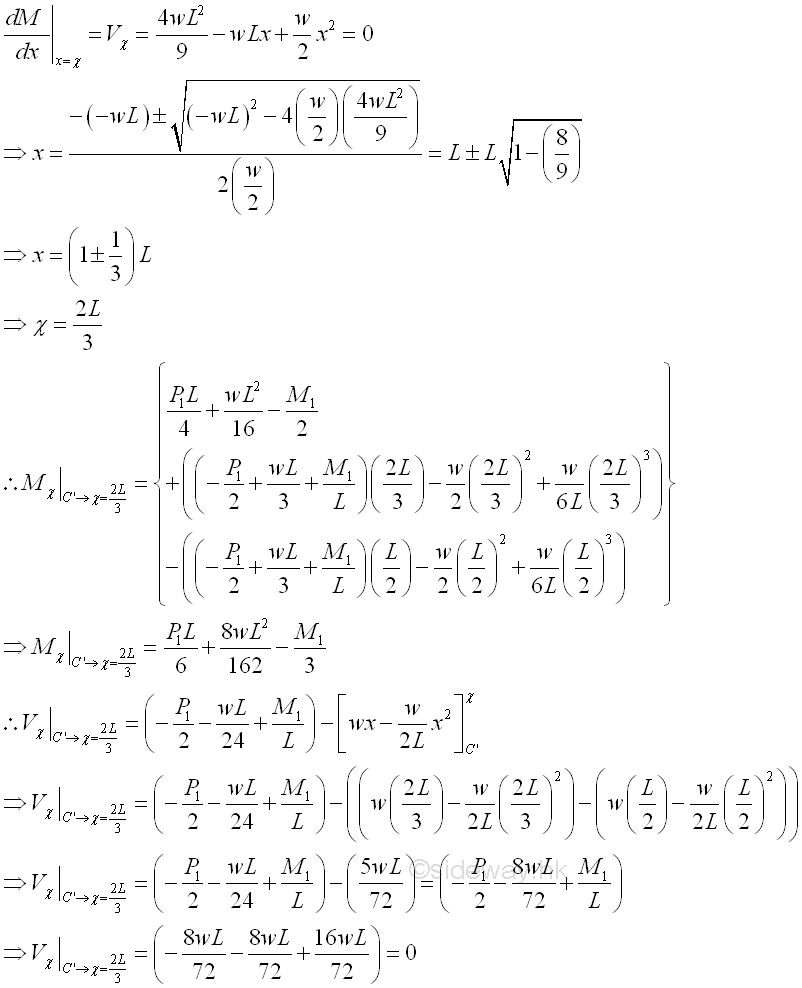
Simply Supported Beam with Uniformly Distributed Moment ExampleFor example, ignoring the horizontal forces, a simply supported beam with uniformly distributed moment of intensity, m per unit length over the span LAB of the beam. 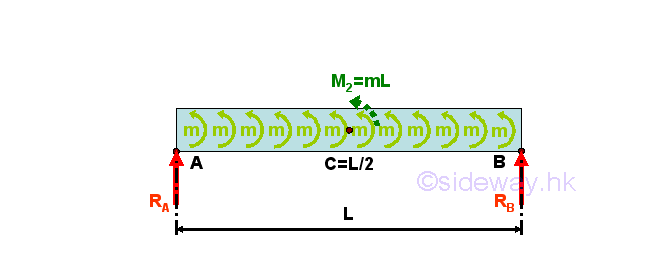
For the uniformly distributed moment of intensity, m per unit length over the span L of the beam. The uniformly distributed moment can be represented by an equivalent concentrated couple M2=mL acting at the centroid of the uniformly distributed moment, i.e. half of the span measured from point A on the simply supported beam. The reaction forces can also be determined by setting up the equilibrium equations. Imply 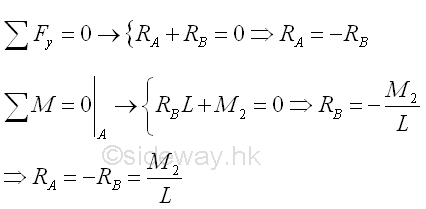
Shear DiagramStart drawing the shear diagram from point A at the left side of the beam at which the beam is in equilibrium and the shear is assumed to be equal to zero. Imply 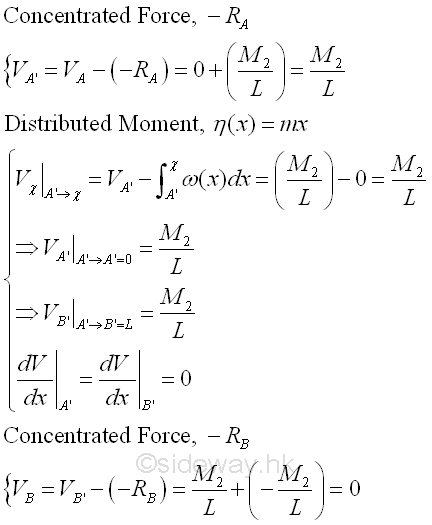
The shear diagram is 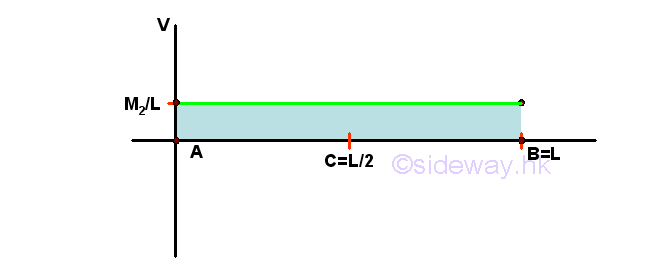
Bending Moment DiagramStart drawing the bending moment diagram from point A at the left side of the beam at which the beam is in equilibrium and the bending moment is assumed to be equal to zero. Imply 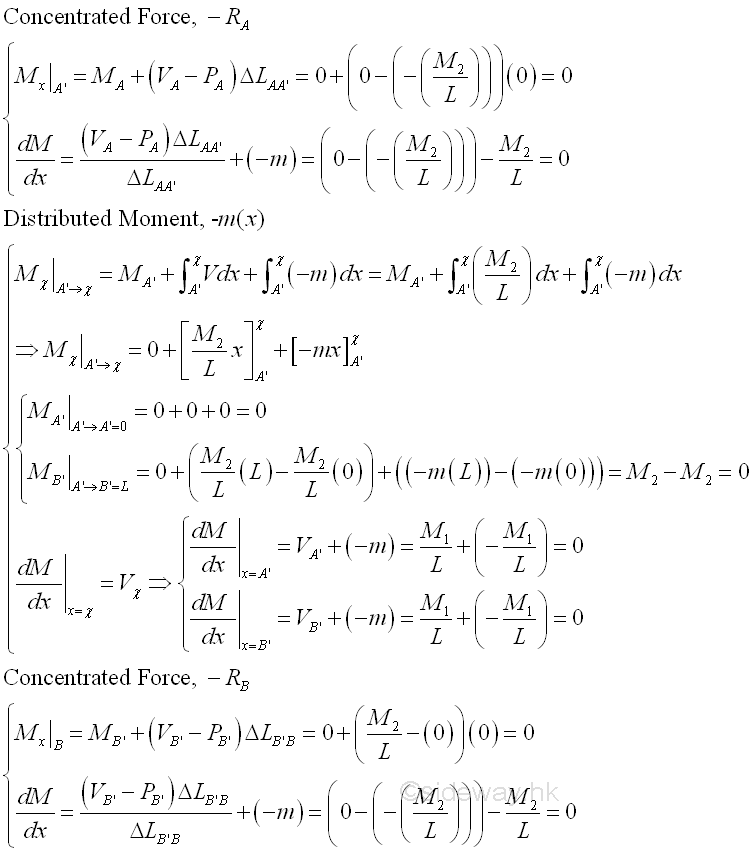
The bending moment diagram is 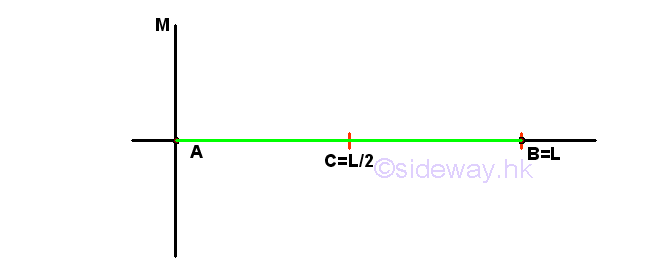
©sideway ID: 120900004 Last Updated: 9/19/2012 Revision: 0 Ref: References
Latest Updated Links
  Nu Html Checker Nu Html Checker  na na |
 Home 5 Business Management HBR 3 Information Recreation Hobbies 9 Culture Chinese 1097 English 339 Travel 45 Reference 79 Hardware 55 Computer Hardware 261 Software Application 213 Digitization 37 Latex 52 Manim 205 KB 1 Numeric 19 Programming Web 289 Unicode 504 HTML 66 CSS 65 SVG 46 ASP.NET 270 OS 431 DeskTop 7 Python 72 Knowledge Mathematics Formulas 8 Set 1 Logic 1 Algebra 84 Number Theory 206 Trigonometry 31 Geometry 34 Calculus 67 Engineering Tables 8 Mechanical Rigid Bodies Statics 92 Dynamics 37 Fluid 5 Control Acoustics 19 Natural Sciences Matter 1 Electric 27 Biology 1 |
Copyright © 2000-2026 Sideway . All rights reserved Disclaimers last modified on 06 September 2019